Regular customer service reports are crucial for showing your department’s worth. They display and make sense of performance data by adding qualitative context, helping you understand how performance evolves over time. This is important not only for you, as a customer service leader, and your team, but also for other departments to understand and recognize the importance of service for customers.
Read on to learn how to write a customer service report that purrfectly exhibits your support quality.
Why you need to create regular customer service reports
First of all, why should you worry about creating reports on your customer support quality?
There is a problem with looking purely at the numbers: they do not provide any context or additional information that could be crucial to understanding how your team is really doing.
You need to ask the initial question: who is this report for?
- For your team to analyze their performance and understand why metrics are tracked.
- For executives and colleagues company-wide to understand the significance of customer service.
Executives or other people in your organization should be able to read a call center report and understand how service quality is (hopefully!) benefitting the company.
Although recognition of the customer support team’s role in company growth is finally shifting, there are still companies who view the support department as a cost center. Proving its worth in meeting customer expectations and fueling retention lies in grabbing attention.

They also help ensure your own team understands the underlying reasons for tracking the metrics and following KPIs. Nearly 85% of employees worldwide are not engaged with their work – and many customer service teams struggle with retaining quality agents. But when you give your team a better vision of performance it’s a catalyst for engagement.
How to write a customer service report in 5 steps
1. Start out with your metrics
You want to create a monthly report that shows your overall support department’s performance, and the purpose is to share with the wider company. What you include in this report would be different to what you would include in a report of an individual agent’s performance, which purpose is to share with their manager.
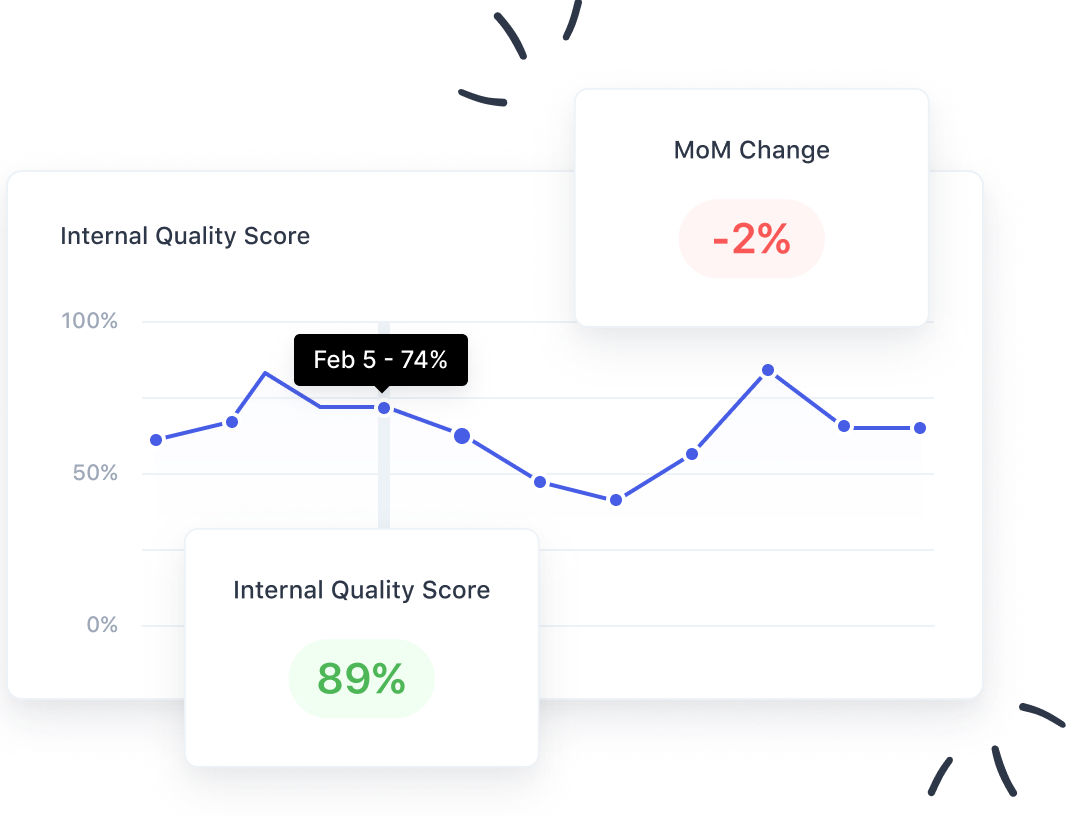
Decide which metrics to include – aligned with which metrics your team gives priority to. For each metric you should show the month’s result and include a comparison to at least the previous month’s result, as this helps understand if things have improved or not.
The most commonly tracked metrics by support teams*
*Taken from our Customer Service Quality Benchmark Report
Customer Support is one area of business that can be spoiled for metrics. CSAT, CES, FRT, FCR, IQS, volume etc. The number of fancy acronyms would put most industries to shame. But picking a small handful that tell the story of what is really important is not easy for that same reason – there are many to choose from. At the same time, these KPIs are the best reflection of what you consider important and ultimately what the team chooses to prioritize, so it does matter a lot.
One way of simplifying it mentally would be to identify 1-3 broad areas that you are currently trying to prioritize and pick KPIs that reflect those. For example quality and speed could mean that to display IQS & CSAT for quality, 1st response time for speed. Keep in mind that if you have “20 important priorities”, you essentially don’t have priorities.
As your report is to be seen and understood by people outside of support, it is important to include all of your tracked metrics and to give an explanation of what they mean. Not everyone knows their FRTs from their FCRs, or their CATs from their CSATs. If you need a little help, we give you license to copy and paste descriptions from our customer service metrics breakdown!

2. Add context
If you got a sneak peek at your engineering team’s performance dashboard, it might look like a foreign language. You see a bunch of numbers and graphs, but could you explain what is going on or understand why a metric has a certain value? Probably not, right?
Make sense of the data by adding qualitative context that tells a story about your team’s performance.
Write a short summary for each metric explaining the result you had. Use dashboards taken from your tech stack for inspiration.
For example, if volumes increased largely for the current month, you may have an understanding of why (i.e new product launch, or an outage of your service). Reports allow you to tell a story about the metrics, so the more details you can share, the more aligned your readers will be in interpreting the results.
If your support department is made up of multiple teams, you might want to include a team breakdown for each of your main metrics. This helps to spot both high and low achievers and also allows you to provide context over each team’s roles and responsibilities.
E.g., one team might have lower volume than others, but its function is to work on more complex, escalated cases. Therefore, the lower volume is not as alarming as first thought. Thorough customer support reports will explain this and give the reader the right context for the numbers they see.
3. News and updates
Aside from tracked metrics you can also include any other relevant data in your general quality report such as:
- Any trainings delivered,
- Number of new joiners in the team,
- Which product launches you supported throughout the month.
It can also be a nice touch to inform the company of any major updates within your department, such as promotions or new positions being formed. This all helps bring insight and understanding to your team’s overall performance.

4. Action items
Finally, include action items or what you are preparing to achieve for the following month. This helps the wider company understand what challenges you are facing and gets them looking forward to next month’s report to see how well you have achieved your goals.
But it is also helpful for you, as a leader, to set out your own goals and subsequently receive recognition for your efforts.
5. Finishing touches
Design is a key element to an engaging report.
Keeping it simple, attractive, and easy to read will mean more eyeballs on it! Reading your report should not be a daunting task, so keeping it readable and clear. Lengthy, mundane spreadsheets are a drain to everyone’s day.
Using a template to keep your customer service reports consistent will also help drive engagement. If people are used to the format and the time of its release, they will soon be on the lookout for your monthly reports!
8 ways to create reports people will actually read
- Make it attractive to read. Some people will want more detail than others so have an overview and the opportunity to dive deeper if they want.
- Make it consistent. Choose a day and time to post it each week/month/quarter.
- Have something running through each report so people come back. e.g dog gifs, AI generated poems, a new instalment of something.
- Add new parts every time so people can see that it is evolving and stay interested.
- Include plenty of visuals e.g graphs and charts. It needs to be easy to consume and attractive.
- Add comparisons to the previous report eg. our response time was 43 seconds, +20 seconds compared to last time.
- Do summary reports, for example, we do a monthly one but also summarise the year.
- Make sure to post it where the right people see it, at the right time of day, at the right time of week. If you post it on Friday night, it will be buried on Monday by people who don’t know how to use threads.

How reports showcase your team’s worth
Customer service reports are critical for teams to showcase their value, communicate their achievements, and establish credibility with other departments and executives. Performance and customer insights can inform strategic decisions and allocate resources more effectively.
But to people who do not work in customer-facing teams, customer sentiment can be a black box. And to anyone not in the frontline of support, customer service efforts can certainly too easily go unnoticed or get taken for granted.
What gets measured gets prioritized.
Companies don’t stand to gain anything by leaving the customer support team waiting in the wings. A way to make it easier for the C-suite to better understand their customers is through monthly reporting. Summaries, analysis, and resources should be routinely examined for a company to be truly customer-centric – but it’s on the Heads of Support to put that information in the right hands.
By presenting data and analysis in a visually compelling and easily understandable format, stakeholders are given a direct line to the customer. Decisions about the company’s future direction and priorities are then made with them in mind.

What other customer service reports should I make?
Well, this is really up to you, however you can make recurring reports on:
- Team performance reports
Share the individual agent metrics per team. This is useful for the team manager to keep track of their own agents’ performances over time. - Individual reports
Dive deep into an individual agent’s performance. This is useful for the team manager, agent, and trainer to understand where the agent can improve. - Training reports
Report on how many training sessions were held, and what the attendance rate and pass rates were. This is useful to understand your team’s adherence as well as how effective your training is. - Project reports
Say you finished a project that involved updating your knowledge base with the goal of reducing your incoming traffic. Creating a report that explains what you did, and compares the incoming volumes before and after projects completion will provide context to the success and challenges of the project itself.
These are just a few suggestions. Ultimately, if you want to communicate any results to anyone else in the company, clean & clear customer support reports are a great way to achieve it.